By providing clear trends and predictive capabilities, Analytics and Business Intelligence can revolutionize your approach to decision-making. Unlock valuable insights from your data to streamline processes, enhance performance, and anticipate future needs. With intuitive tools designed for practical use, you can turn complex information into strategic advantages and drive your business forward with confidence.
Learn what Unified Portal
can do for your business
Shape Your
Business Strategy
with Intelligent
Data Analysis
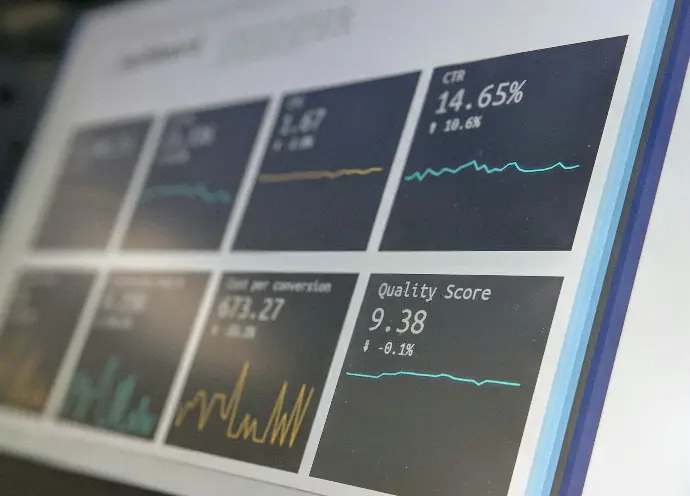
Financial Data and Analytics
Custom Dashboards
Custom dashboards provide tailored visualizations of financial data, helping users track spending, investment performance, and overall financial health. These dashboards allow for a clearer view of key metrics, supporting better financial decision-making and strategic planning.
Open Banking APIs
Open banking APIs facilitate connectivity with various financial institutions, enabling users to aggregate and manage data from multiple accounts in one place. This integration streamlines financial data management and provides a comprehensive view of economic activities.
AI-Powered Insights
AI-driven insights analyze data to offer personalized financial advice, detect patterns, and predict future financial needs. By utilizing advanced algorithms, these insights enhance financial planning and help users make informed decisions based on data-driven predictions

Real-Time Data Insights
Dynamic Dashboards
Dynamic dashboards offer real-time visibility into key metrics, allowing users to track performance and operational status instantly. These dashboards can be customized to display relevant data, such as sales figures, customer engagement metrics, or operational efficiency indicators. By providing live updates, businesses can respond quickly to emerging trends and make data-driven decisions that enhance overall performance.
Live Data Feeds
Integrating live data feeds from multiple sources ensures that your organization has up-to-date information at its fingertips. This could include market data, social media trends, or operational metrics. Having access to real-time information helps in making timely decisions, optimizing processes, and staying ahead of competitors by understanding current market conditions and customer behaviors.
Instant Alerts
Setting up instant alerts for significant data changes or anomalies allows for immediate action when critical issues arise. For example, you can receive notifications about unexpected drops in sales, spikes in customer complaints, or discrepancies in inventory levels. This proactive approach ensures that potential problems are addressed swiftly, reducing the impact on your business and enabling more agile responses.

Predictive Analytics
Forecasting Models
Forecasting models utilize historical data and statistical algorithms to predict future trends and outcomes. By analyzing past performance and market conditions, businesses can forecast sales, customer demand, or financial performance. These predictions help in strategic planning, budgeting, and resource allocation, allowing organizations to prepare for future scenarios and capitalize on anticipated opportunities.
Trend Analysis
Trend analysis involves examining historical data to identify long-term patterns and trends. This can include tracking changes in customer preferences, market shifts, or seasonal variations. Understanding these trends helps businesses make informed strategic decisions, anticipate future needs, and adjust their strategies to align with evolving market dynamics.
Risk Assessment
Risk assessment tools analyze potential risks and uncertainties based on historical data and predictive models. By identifying and evaluating potential threats, businesses can develop mitigation strategies and contingency plans. This proactive approach helps in managing risks effectively, reducing the likelihood of negative impacts, and ensuring business continuity.
Ready to build your
Unified Portal?
Data Integration and Aggregation
Unified Data Repositories
Consolidate information from various sources into a single, accessible platform. This centralization improves data accuracy and provides a comprehensive view of business operations. It simplifies data management by reducing duplication and inconsistencies, enabling more effective analysis and reporting across departments or business units.
Cross-Platform Connectivity
Cross-platform connectivity allows for seamless integration with external systems, such as CRM, ERP, or other business applications. This connectivity ensures that data flows smoothly between systems, improving overall data accuracy and consistency. It supports a holistic view of business performance and enhances the ability to manage and analyze data from different sources.
Data Aggregation Tools
Combine data from multiple systems and formats into a cohesive dataset. This process simplifies data analysis by providing a unified view of information. Aggregating data enables organizations to generate comprehensive reports, identify trends, and derive actionable insights, facilitating better decision-making and strategic planning

Custom Reporting
Automated Report Generation
Automated report generation creates and distributes reports based on predefined criteria and schedules. This reduces manual effort and ensures that reports are delivered consistently and on time. Automated reporting tools can handle various types of reports, such as financial summaries, performance metrics, or compliance reports, improving efficiency and accuracy in reporting tasks.
Interactive Reporting
Interactive reporting tools allow users to explore data dynamically through features such as drill-downs, filters, and customizable views. This interactivity helps users engage with data more effectively, uncovering deeper insights and patterns. Interactive reports enable users to tailor their analysis to specific needs, providing a more detailed understanding of the data.